Organization Report
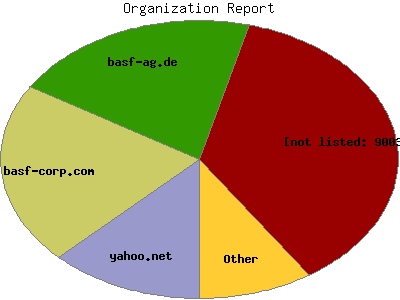
The Organization Report attempts to list the organizations (companies, institutions, ISPs etc.) whose computers accessed your site. In general this is similar to the Domain report but shows the servers one level up in the name-tree. This report can also show a hierarchy of servers within an organization. For example aol.com has many proxy-nnn.aol.com servers.
This report shows the first 20 results by number of requests. This report is sorted by number of requests.
| Organization | Number of requests | Percentage of the requests | Number of page requests | Percentage of the page requests | Percentage of the bytes | |
|---|---|---|---|---|---|---|
| 1. | msft.net | 234,115 | 19.15% | 5,767 | 2.18% | 12.66% |
| 2. | yahoo.net | 115,258 | 9.43% | 33,185 | 12.54% | 18.73% |
| 3. | basf-corp.com | 56,818 | 4.65% | 56,120 | 21.20% | 0.61% |
| 4. | basf-ag.de | 53,908 | 4.41% | 53,696 | 20.29% | 0.58% |
| 5. | veloxzone.com.br | 50,636 | 4.14% | 113 | 0.04% | 5.50% |
| 6. | orange.es | 36,024 | 2.95% | 25 | 0.01% | 3.67% |
| 7. | cuill.com | 28,405 | 2.32% | 3,401 | 1.28% | 1.09% |
| 8. | hostnoc.net | 13,715 | 1.12% | 142 | 0.05% | 7.43% |
| 9. | apnic.net | 11,372 | 0.93% | 2,042 | 0.77% | 0.89% |
| 10. | dsl.bell.ca | 10,747 | 0.88% | 163 | 0.06% | 1.28% |
| 11. | managedsg-inc.com | 10,281 | 0.84% | 22 | 0.01% | 0.72% |
| 12. | comcast.net | 10,102 | 0.83% | 1,170 | 0.44% | 0.70% |
| 13. | ecatel.net | 9,053 | 0.74% | 465 | 0.18% | 0.21% |
| 14. | bta.net.cn | 8,966 | 0.73% | 6,929 | 2.62% | 0.51% |
| 15. | become.com | 8,924 | 0.73% | 1,191 | 0.45% | 0.58% |
| 16. | ultranet.lv | 8,730 | 0.71% | 40 | 0.01% | 0.40% |
| 17. | amazonaws.com | 8,255 | 0.68% | 2,240 | 0.85% | 1.07% |
| 18. | verizon.net | 7,951 | 0.65% | 511 | 0.19% | 0.42% |
| 19. | internetserviceteam.com | 7,855 | 0.64% | 257 | 0.10% | 0.24% |
| 20. | ubiquityservers.com | 7,672 | 0.63% | 134 | 0.05% | 2.99% |
| [not listed: 9003] | 523,463 | 42.83% | 97,086 | 36.68% | 39.71% | |

