Hourly Summary
The Hourly Summary identifies the level of activity broken down by each hour. Remember that one page hit can result in several server requests as the images for each page are loaded. This summary also compares the level of activity during working hours and after hours as a total for the report time frame.
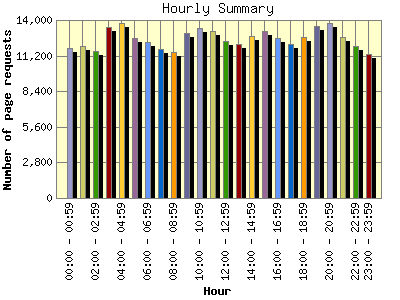
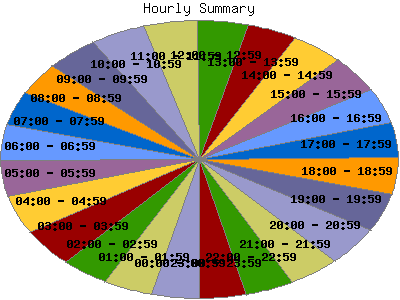
| Hour | Number of page requests | Percentage of the page requests | Number of requests | Percentage of the requests | |
|---|---|---|---|---|---|
| 1. | 00:00 - 00:59 | 11,764 | 3.91% | 53,046 | 3.64% |
| 2. | 01:00 - 01:59 | 11,933 | 3.96% | 54,139 | 3.71% |
| 3. | 02:00 - 02:59 | 11,592 | 3.85% | 57,704 | 3.96% |
| 4. | 03:00 - 03:59 | 13,418 | 4.46% | 63,844 | 4.38% |
| 5. | 04:00 - 04:59 | 13,745 | 4.56% | 61,594 | 4.22% |
| 6. | 05:00 - 05:59 | 12,594 | 4.18% | 65,170 | 4.47% |
| 7. | 06:00 - 06:59 | 12,306 | 4.09% | 63,371 | 4.34% |
| 8. | 07:00 - 07:59 | 11,751 | 3.90% | 62,547 | 4.29% |
| 9. | 08:00 - 08:59 | 11,507 | 3.82% | 64,036 | 4.39% |
| 10. | 09:00 - 09:59 | 12,948 | 4.30% | 66,439 | 4.55% |
| 11. | 10:00 - 10:59 | 13,332 | 4.43% | 68,934 | 4.72% |
| 12. | 11:00 - 11:59 | 13,145 | 4.37% | 68,400 | 4.69% |
| 13. | 12:00 - 12:59 | 12,387 | 4.11% | 66,390 | 4.55% |
| 14. | 13:00 - 13:59 | 12,140 | 4.03% | 60,257 | 4.13% |
| 15. | 14:00 - 14:59 | 12,764 | 4.24% | 62,743 | 4.30% |
| 16. | 15:00 - 15:59 | 13,146 | 4.37% | 60,972 | 4.18% |
| 17. | 16:00 - 16:59 | 12,586 | 4.18% | 61,529 | 4.22% |
| 18. | 17:00 - 17:59 | 12,083 | 4.01% | 56,392 | 3.87% |
| 19. | 18:00 - 18:59 | 12,688 | 4.21% | 57,336 | 3.93% |
| 20. | 19:00 - 19:59 | 13,564 | 4.50% | 59,631 | 4.09% |
| 21. | 20:00 - 20:59 | 13,801 | 4.58% | 55,399 | 3.80% |
| 22. | 21:00 - 21:59 | 12,660 | 4.21% | 55,584 | 3.81% |
| 23. | 22:00 - 22:59 | 11,926 | 3.96% | 55,795 | 3.83% |
| 24. | 23:00 - 23:59 | 11,320 | 3.76% | 57,601 | 3.95% |
| Work Hours (8:00am-4:59pm) | 113,955 | 37.85% | 579,700 | 39.74% | |
| After Hours (5:00pm-7:59am) | 187,145 | 62.16% | 879,153 | 60.26% | |

