Quarterly Report
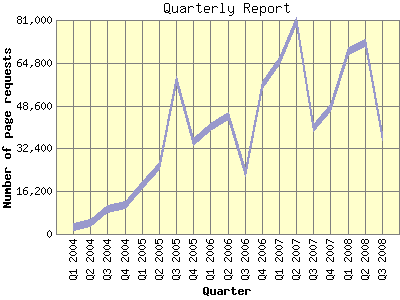
The Quarterly Report shows total activity on your site for each quarter of a
year. Remember that each page hit can result in several server requests as the
images for each page are loaded.
Note: Most likely, the first and
last quarters will not represent a complete quarter's worth of data, resulting
in lower hits.

| Quarter | Number of page requests | Percentage of the page requests | Number of requests | Percentage of the requests | |
|---|---|---|---|---|---|
| 1. | Q1 2004 | 2,679 | 0.36% | 3,408 | 0.13% |
| 2. | Q2 2004 | 4,113 | 0.55% | 4,880 | 0.18% |
| 3. | Q3 2004 | 9,334 | 1.26% | 12,065 | 0.45% |
| 4. | Q4 2004 | 11,153 | 1.50% | 14,032 | 0.52% |
| 5. | Q1 2005 | 18,422 | 2.48% | 29,389 | 1.09% |
| 6. | Q2 2005 | 25,588 | 3.45% | 65,839 | 2.44% |
| 7. | Q3 2005 | 58,144 | 7.84% | 126,518 | 4.70% |
| 8. | Q4 2005 | 34,959 | 4.71% | 107,972 | 4.01% |
| 9. | Q1 2006 | 40,520 | 5.46% | 112,453 | 4.17% |
| 10. | Q2 2006 | 44,790 | 6.04% | 135,489 | 5.03% |
| 11. | Q3 2006 | 23,164 | 3.12% | 146,558 | 5.44% |
| 12. | Q4 2006 | 56,547 | 7.62% | 180,122 | 6.69% |
| 13. | Q1 2007 | 65,566 | 8.84% | 207,807 | 7.71% |
| 14. | Q2 2007 | 80,755 | 10.89% | 251,841 | 9.35% |
| 15. | Q3 2007 | 40,084 | 5.40% | 278,172 | 10.33% |
| 16. | Q4 2007 | 47,604 | 6.42% | 267,727 | 9.94% |
| 17. | Q1 2008 | 69,228 | 9.33% | 201,799 | 7.49% |
| 18. | Q2 2008 | 72,425 | 9.76% | 324,363 | 12.04% |
| 19. | Q3 2008 | 36,762 | 4.96% | 223,383 | 8.29% |
Most active quarter Q2 2007 : 251,841 requests handled. 80,755 pages sent.
Quarterly average: 141,779 requests handled. 39,044 pages sent.

